

Rotation grid: the next 7 days
Every listed starter by team and date. A dash means no game that day, TBA means the club has a game but has not named its starter yet.
| Team | Today | Wed, Oct 7 | Thu, Oct 8 | Fri, Oct 9 | Sat, Oct 10 | Sun, Oct 11 | Mon, Oct 12 |
|---|---|---|---|---|---|---|---|
| AL High | - | - | - | - | - | - | TBAvs AL Low |
| AL Low | - | - | - | - | - | - | TBA@ AL High |
| ATL | SaleLHPvs LAD | TBAvs LAD | - | TBA@ LAD | - | - | - |
| CLE | - | TBA@ CWS | TBA@ CWS | - | TBAvs CWS | - | - |
| CWS | - | TBAvs CLE | TBAvs CLE | - | TBA@ CLE | - | - |
| LAD | YamamotoRHP@ ATL | TBA@ ATL | - | TBAvs ATL | - | - | - |
| MIL | MayRHP@ SD | TBA@ SD | - | TBAvs SD | - | - | - |
| NL High | - | - | - | - | - | TBAvs NL Low | TBAvs NL Low |
| NL Low | - | - | - | - | - | TBA@ NL High | TBA@ NL High |
| NYY | - | FriedLHPvs TB | RodónLHPvs TB | - | TBA@ TB | - | - |
| SD | PivettaRHPvs MIL | TBAvs MIL | - | TBA@ MIL | - | - | - |
| TB | - | MartinezRHP@ NYY | TBA@ NYY | - | TBAvs NYY | - | - |
Probable pitchers board
Today · Tuesday, October 6, 2026
 Yoshinobu Yamamoto RHP Los Angeles Dodgers
 Last 5 starts
| Date | Opp | IP | ER | K | P |
|---|---|---|---|---|---|
| 09-23 | vs Padres | 6.0 | 2 | 4 | 88 |
| 09-15 | @ Reds | 7.0 | 0 | 7 | 91 |
| 09-09 | vs Reds | 7.0 | 1 | 10 | 90 |
| 09-02 | vs Cardinals | 7.0 | 4 | 8 | 93 |
| 08-27 | @ Braves | 6.1 | 1 | 8 | 105 |
 Chris Sale LHP Atlanta Braves
 Last 5 starts
| Date | Opp | IP | ER | K | P |
|---|---|---|---|---|---|
| 09-23 | vs Reds | 5.2 | 1 | 10 | 97 |
| 09-11 | vs Phillies | 7.0 | 3 | 6 | 94 |
| 09-04 | @ Phillies | 6.0 | 2 | 7 | 103 |
| 08-27 | vs Dodgers | 9.0 | 0 | 11 | 109 |
| 08-21 | @ Brewers | 6.0 | 2 | 6 | 94 |
 Dustin May RHP Milwaukee Brewers
 Last 5 starts
| Date | Opp | IP | ER | K | P |
|---|---|---|---|---|---|
| 09-26 | vs Cardinals | 3.0 | 2 | 5 | 58 |
| 09-22 | @ Phillies | 2.0 | 2 | 2 | 36 |
| 09-18 | @ Orioles | 2.1 | 3 | 4 | 70 |
| 09-11 | vs Reds | 6.0 | 0 | 6 | 84 |
| 09-05 | @ Reds | 3.2 | 2 | 5 | 56 |
 Nick Pivetta RHP San Diego Padres
 Last 5 starts
| Date | Opp | IP | ER | K | P |
|---|---|---|---|---|---|
| 09-24 | @ Dodgers | 4.2 | 0 | 7 | 87 |
| 09-18 | vs Marlins | 5.0 | 1 | 4 | 76 |
| 09-13 | @ Giants | 4.0 | 2 | 5 | 69 |
| 09-07 | vs Nationals | 5.0 | 0 | 2 | 63 |
| 04-12 | vs Rockies | 3.0 | 0 | 4 | 46 |
Photos: Yoshinobu Yamamoto: All-Pro Reels from District of Columbia, USA, CC BY-SA 2.0 · Chris Sale: Keith Allison from Hanover, MD, USA, CC BY-SA 2.0 · Dustin May: Johnmaxmena2, CC BY 4.0 · Nick Pivetta: Ian D'Andrea from Philadelphia, PA, CC BY-SA 2.0 via Wikimedia Commons.
Wednesday, October 7, 2026
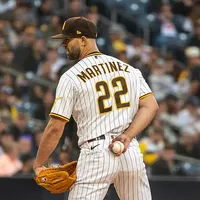 Nick Martinez RHP Tampa Bay Rays
 Last 5 starts
| Date | Opp | IP | ER | K | P |
|---|---|---|---|---|---|
| 09-27 | @ Phillies | 2.2 | 4 | 1 | 50 |
| 09-22 | @ Yankees | 6.0 | 2 | 7 | 94 |
| 09-16 | vs Athletics | 5.0 | 2 | 3 | 72 |
| 09-10 | @ Braves | 6.1 | 0 | 3 | 68 |
| 09-04 | @ Rangers | 6.1 | 3 | 4 | 90 |
 Max Fried LHP New York Yankees
 Last 5 starts
| Date | Opp | IP | ER | K | P |
|---|---|---|---|---|---|
| 09-22 | vs Rays | 6.2 | 4 | 4 | 97 |
| 09-15 | @ Twins | 7.0 | 1 | 6 | 88 |
| 09-10 | vs Rockies | 3.1 | 1 | 7 | 80 |
| 09-04 | @ Padres | 5.2 | 1 | 4 | 72 |
| 08-29 | vs Sox | 3.2 | 1 | 4 | 63 |
Photos: Nick Martinez: Ryan Casey Aguinaldo, CC BY-SA 4.0 · Max Fried: YESNetwork, CC BY 3.0 via Wikimedia Commons.
Thursday, October 8, 2026
 Carlos Rodón LHP New York Yankees
 Last 5 starts
| Date | Opp | IP | ER | K | P |
|---|---|---|---|---|---|
| 09-22 | vs Rays | 8.0 | 0 | 8 | 96 |
| 09-16 | @ Twins | 6.0 | 2 | 5 | 102 |
| 09-11 | vs Mets | 6.1 | 1 | 8 | 93 |
| 09-05 | @ Padres | 5.0 | 1 | 7 | 89 |
| 08-29 | vs Sox | 4.2 | 2 | 5 | 88 |
Photos: Carlos Rodón: YESNetwork, CC BY 4.0 via Wikimedia Commons.
Friday, October 9, 2026
Saturday, October 10, 2026
Sunday, October 11, 2026
Monday, October 12, 2026
Source: MLB Stats API (statsapi.mlb.com). 2026 regular season unless marked otherwise. Updated Oct 6, 2026, 4:51 AM ET. Pitcher lines are regular-season totals. Teams can change a listed starter up to game time.
Every baseball bet starts with one question: who is on the mound? The board above answers it for today and the next six days, with the season line for every announced starter next to his name. What follows is how we read MLB probable pitchers, where the stats hold up and where they fall apart, and how a starting pitcher moves the prices you see on a moneyline or a total.
How to read the MLB probable pitchers board
Each row on the board is one game. The away team is on the left and the home team on the right, the first pitch is shown in Eastern Time, and the venue sits under the teams. For each side you get the listed starter, the hand he throws with, and four numbers from his current regular season: ERA, WHIP, strikeouts per nine innings (K/9) and games started (GS). If a club has not named its starter, the slot says so instead of guessing.
The data comes straight from MLB’s own statistics feed and the page refreshes every day, so the probable pitchers today are the ones the teams themselves have posted. We do not fill empty slots with a projected rotation. A projection is a useful thing, and plenty of fantasy baseball sites publish pitcher projections for the next ten days, but it is a guess about the future, and a betting page should show you what is announced and label the rest.
One detail matters more than it looks: the season line is regular-season only. In spring training or October, the numbers you see are still the regular season, which is usually what you want, since a postseason sample of two or three starts tells you almost nothing.

Why today’s starter can still change
A “probable” pitcher is exactly what the word says. Clubs usually set their rotation several days out, and most fans can tell you who starts on Sunday by the middle of the week. The name becomes firm on game day, when the lineup cards go up a few hours before first pitch.
Between those two moments a lot can happen. A starter wakes up with a stiff back. A rainout on Tuesday pushes everybody back a day. A team clinches a playoff spot and decides to rest its ace. Late in the season a club might skip a struggling fifth starter entirely because an off day lets the top of the rotation pitch on regular rest. When you check the board a few days ahead, treat those later dates as a draft. The closer you get to today, the more reliable the list becomes.
That is why sharp baseball bettors tend to wait until the starter is confirmed before betting a side, or they bet early on purpose, knowing the price could move against them if a scratch happens.
What the starter stats tell you, and what they hide
The four numbers on the board are a quick read, not a verdict. Each one has a specific weakness you should know about.
ERA (earned run average) is the runs a pitcher allowed per nine innings, minus the ones caused by errors. It is the stat everybody knows, and it is noisy. A pitcher with a 3.20 ERA and one with a 4.10 ERA may have pitched almost identically, with the gap coming from where the hits fell, how good the defense behind them was, and what the bullpen did with the runners they left on base.
WHIP (walks plus hits per inning pitched) measures how much traffic a pitcher allows. It is a little steadier than ERA because it does not depend on the order in which the hits and walks arrived. A 1.10 WHIP means roughly one base runner every inning, which is very good. Anything over 1.40 means a pitcher is working out of trouble most nights.
K/9 tells you how often a pitcher finishes hitters himself. Strikeouts are the part of pitching a defense cannot mess up, so K/9 is one of the more trustworthy numbers on the board, and it is the first one to check for strikeout props.
GS is the sample size, and it is the number people skip. A pitcher with 4 starts and a 1.80 ERA has thrown maybe 22 innings. That is a hot month, not a skill level. By 20 or more starts the other numbers start to mean something. Early in the season, or for a pitcher just called up from the minors, lean on the GS column before you trust anything next to it.
The FIP idea
Analysts built a stat called FIP (fielding independent pitching) to get around the noise in ERA. The idea, popularized by Tom Tango, is to look only at the outcomes a pitcher controls without help: strikeouts, walks, hit batters and home runs. Everything else, the balls in play, is treated as a mix of defense and luck. We do not show FIP on the board, but you can apply the thinking yourself. When a pitcher has a shiny ERA with a mediocre K/9 and a high WHIP, the ERA is the number most likely to get worse. When the ERA is ugly but the strikeouts are strong and the walks are low, the market may be overreacting to bad luck.
Handedness and platoon matchups
The small L or R next to each starter is the throwing hand, and it shapes the lineup he will face. Hitters generally do better against pitchers who throw from the opposite side: a left-handed batter sees a right-hander’s pitches longer and has an easier time picking up breaking balls. Managers stack their lineups to exploit that, which is why a team full of left-handed bats can look very different against a lefty.
So when you study MLB pitching matchups, do not stop at the pitcher’s line. Ask how the opposing lineup is built. A right-hander with modest numbers facing a lineup heavy with right-handed hitters is in a better spot than his ERA suggests. A soft-tossing lefty against a team that crushes left-handed pitching is walking into a tough day, and the season line on the board will not show that. Split stats (a pitcher’s numbers against lefties and righties) are the next step if you want to dig in.
Openers, bullpen games and the TBA slot
Not every game has a traditional starter. The Tampa Bay Rays made the opener famous in 2018: a reliever pitches the first inning or two, then a longer pitcher takes over. Other clubs now use a “bullpen game” when a rotation spot is empty, chaining four or five relievers together.
For betting, these games are awkward. The listed pitcher may throw 20 pitches, so his ERA and WHIP say little about how the game will go, and bets that depend on the starter (first five innings, strikeout props) become much harder to price. When the board shows a reliever with a handful of starts, or a TBA close to game time, assume you are looking at an opener or a bullpen game and adjust. Some bettors simply skip first five innings bets in those games.
How starters move lines and totals
The starting pitcher is the biggest single input in a baseball price. A team with its ace on the mound can be -180, and the same team with a spot starter the next night might be -120 against the same opponent. Totals move too: swap a strikeout pitcher for a replacement and an 8 can become an 8.5 or a 9.
This is why lines are often posted late, or pulled for a while, when a starter is uncertain. It also means the market has already priced the obvious. If the board shows a pitcher with a 2.50 ERA facing one with a 5.40, the moneyline knows. Value, if there is any, tends to come from details the headline numbers blur: a sample that is too small, a platoon edge, a park that suits one pitcher’s style, or a bullpen that will pitch the last four innings either way. To see what a price actually implies, run it through our odds calculators and compare the break-even percentage to your own read.
If your starter is scratched: action vs listed pitchers
Suppose you bet the Mets at -140 because their best starter was listed, and an hour before the game he is scratched. What happens depends on how the bet was set up.
With an action bet, your wager stands regardless of who pitches. The book usually adjusts the price to reflect the new matchup, so the -140 you took may be settled at a different number. With a listed pitchers bet, the wager only has action if both named starters throw the first pitch; if either one does not, the bet is void and your stake comes back. Some books also offer a version tied to just one pitcher. Totals, run lines and first five innings bets often follow listed-pitcher rules by default at many books, but defaults vary. Our page on baseball betting rules covers the settlement terms in more detail, and it is worth reading the house rules of wherever you bet before a scratch forces the question.
Using the board with the rest of the site
The board is a starting point. Here is how we use MLB probable pitchers in practice, one market at a time.
For a side or a total, open the matchup data for each game, which puts both listed starters next to team records, run differential and first-inning scoring. Starting pitching decides a lot, but a strong starter backed by a tired bullpen is a different bet from the same starter with a rested one.
For first 5 innings bets, the starter is almost the whole story, because the bullpens are cut out of the bet. That makes the board more useful here than anywhere else. Look for a clear gap between the two starters that the full-game price does not fully reflect.
For strikeout prop bets, start with the K/9 column and the GS sample, then check the opposing lineup’s strikeout tendency. A pitcher averaging 10 strikeouts per nine innings will not always clear 6.5 against a contact-heavy lineup, and a short leash from the manager can cap the total no matter how good the stuff is.
For first-inning markets, the listed starter is half of a NRFI bet, and our NRFI page ranks starters by how often they get through the first inning clean.
If you want the terms behind all of this, including how a moneyline and a run line are priced, start with our guide to reading baseball betting lines, or go back to the baseballbetting.us homepage for the full list of guides and data pages.
A realistic morning routine with the board
Here is how a careful bettor might use probable pitchers today without spending an hour on it, and it works the same whether you check the MLB probable pitchers at 9 am ET or an hour before the first game. The season stats come first, the price comes last. First, scan the board for games where a starter is still TBA or has fewer than eight starts; mark those as low-confidence. Second, find the games where the two season lines look far apart, and ask whether the moneyline already reflects that gap. Third, check handedness against the opposing lineup for the two or three MLB pitching matchups that interest you most. Only then look at prices.
Say you like a right-hander with a 1.12 WHIP and 9.8 K/9 over 24 starts, facing a lineup heavy with right-handed hitters, and his team is -125. At -125 you need to win 55.6% of the time to break even. If your honest read is that this matchup wins closer to 58%, there is a thin edge; if you cannot say why it is better than 55.6%, pass. Most days, most games are a pass, and that is fine. Keep bets to an amount you can afford to lose, you must be 21 or older to bet in the US, and if betting stops being fun, call 1-800-GAMBLER.
Late in the day, check the board one more time. A scratch at 5 pm ET is common enough that the name you based the bet on may not be the one who takes the ball, and it is far better to find that out before first pitch than after.

_(cropped).jpg)
_(cropped).jpg)

_(cropped).jpg)

.png)
_(cropped).png)
