

NRFI board for the next games
Every listed game with the numbers that shape a first inning: each starter's clean-first-inning rate and first-inning ERA, each lineup's first-inning scoring rate and the home park's scoring level. League average NRFI: 49.4%.

- Clean 1st
- 71.4%
- 1st-inn ERA
- 3.54
- Team scores 1st
- 29.6%
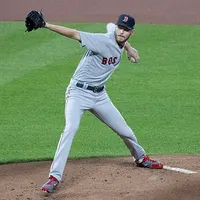
- Clean 1st
- 85.2%
- 1st-inn ERA
- 1.33
- Team scores 1st
- 30.7%
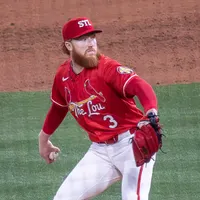
- Clean 1st
- 71%
- 1st-inn ERA
- 6.10
- Team scores 1st
- 30.9%
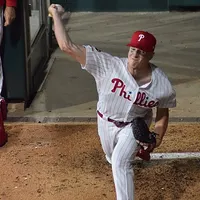
- Clean 1st
- -
- 1st-inn ERA
- 4.50
- Team scores 1st
- 24.7%
- Clean 1st
- -
- 1st-inn ERA
- -
- Team scores 1st
- 28.4%
- Clean 1st
- -
- 1st-inn ERA
- -
- Team scores 1st
- 32.7%
- Clean 1st
- -
- 1st-inn ERA
- -
- Team scores 1st
- 29.6%
- Clean 1st
- -
- 1st-inn ERA
- -
- Team scores 1st
- 30.7%
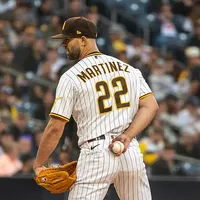
- Clean 1st
- 83.9%
- 1st-inn ERA
- 1.74
- Team scores 1st
- 32.1%
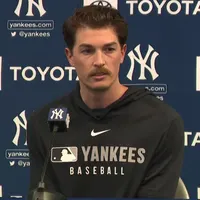
- Clean 1st
- 80%
- 1st-inn ERA
- 3.15
- Team scores 1st
- 28%
- Clean 1st
- -
- 1st-inn ERA
- -
- Team scores 1st
- 30.9%
- Clean 1st
- -
- 1st-inn ERA
- -
- Team scores 1st
- 24.7%
NRFI rate by team
League-wide, 49.4% of 2,430 regular-season games had a scoreless first inning. The table ranks every team by the share of its games that stayed scoreless through one full inning.
| Team | Games | NRFI % | Scored in 1st | Allowed in 1st |
|---|---|---|---|---|
| Miami Marlins | 162 | 59.9% | 25.3% | 25.3% |
| San Diego Padres | 162 | 59.3% | 24.7% | 24.1% |
| Baltimore Orioles | 161 | 55.9% | 25.5% | 28.6% |
| Cleveland Guardians | 162 | 55.6% | 28.4% | 25.3% |
| Pittsburgh Pirates | 162 | 53.1% | 30.9% | 22.8% |
| Chicago Cubs | 162 | 53.1% | 27.8% | 24.1% |
| Tampa Bay Rays | 162 | 52.5% | 32.1% | 24.1% |
| Milwaukee Brewers | 162 | 51.9% | 30.9% | 22.8% |
| Los Angeles Dodgers | 162 | 51.9% | 29.6% | 27.8% |
| New York Yankees | 161 | 51.6% | 28% | 26.1% |
| St. Louis Cardinals | 162 | 51.2% | 29.6% | 31.5% |
| Atlanta Braves | 163 | 50.9% | 30.7% | 28.8% |
| Detroit Tigers | 162 | 50.6% | 33.3% | 25.9% |
| Los Angeles Angels | 162 | 50% | 33.3% | 24.1% |
| Toronto Blue Jays | 162 | 50% | 24.7% | 31.5% |
| Washington Nationals | 162 | 49.4% | 30.9% | 27.8% |
| New York Mets | 162 | 48.8% | 30.2% | 32.1% |
| Boston Red Sox | 162 | 48.8% | 24.7% | 34.6% |
| San Francisco Giants | 163 | 48.5% | 28.8% | 31.3% |
| Kansas City Royals | 162 | 47.5% | 33.3% | 32.1% |
| Cincinnati Reds | 162 | 46.9% | 26.5% | 35.8% |
| Houston Astros | 162 | 46.9% | 34% | 29.6% |
| Philadelphia Phillies | 162 | 46.3% | 32.1% | 26.5% |
| Athletics | 162 | 46.3% | 27.8% | 35.8% |
| Arizona Diamondbacks | 162 | 45.7% | 29% | 32.7% |
| Seattle Mariners | 162 | 45.7% | 30.2% | 34% |
| Chicago White Sox | 162 | 44.4% | 32.7% | 34% |
| Texas Rangers | 162 | 40.7% | 29.6% | 34.6% |
| Minnesota Twins | 162 | 40.1% | 34.6% | 35.8% |
| Colorado Rockies | 162 | 38.3% | 31.5% | 41.4% |
Today's starters in the first inning
Every listed starter on the next slate with his first-inning ERA this season and how often the opponent was held scoreless in his first inning.
| Starter | Game | 1st-inning ERA | 1st-inning IP | Clean 1st |
|---|---|---|---|---|
| Yoshinobu Yamamoto | LAD vs ATL | 3.54 | 28.0 | 71.4% (28 starts) |
| Chris Sale | ATL vs LAD | 1.33 | 27.0 | 85.2% (27 starts) |
| Dustin May | MIL vs SD | 6.10 | 20.2 | 71% (31 starts) |
| Nick Pivetta | SD vs MIL | 4.50 | 8.0 | - |
Photos: Yoshinobu Yamamoto: All-Pro Reels from District of Columbia, USA, CC BY-SA 2.0 · Chris Sale: Keith Allison from Hanover, MD, USA, CC BY-SA 2.0 · Dustin May: Johnmaxmena2, CC BY 4.0 · Nick Pivetta: Ian D'Andrea from Philadelphia, PA, CC BY-SA 2.0 via Wikimedia Commons.
Starters with the cleanest first innings
Share of a listed starter's games in which the opponent did not score in its first-inning half. Minimum 15 starts.
| Pitcher | Team | Starts | Clean 1st | Rate |
|---|---|---|---|---|
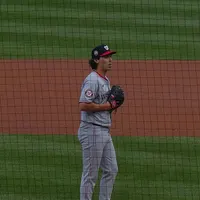 Andrew Alvarez Andrew Alvarez | WSH | 17 | 16 | 94.1% |
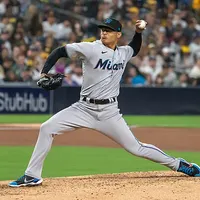 Jesús Luzardo Jesús Luzardo | PHI | 29 | 27 | 93.1% |
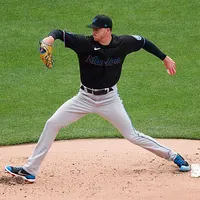 Trevor Rogers Trevor Rogers | BAL | 30 | 27 | 90% |
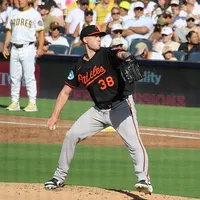 Kyle Bradish Kyle Bradish | BAL | 29 | 26 | 89.7% |
| Logan Henderson | MIL | 18 | 16 | 88.9% |
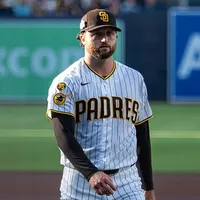 Casey Mize Casey Mize | DET | 26 | 23 | 88.5% |
 Cam Schlittler Cam Schlittler | NYY | 33 | 29 | 87.9% |
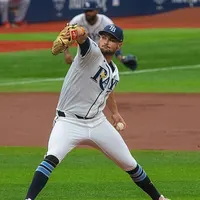 Shane McClanahan Shane McClanahan | TB | 24 | 21 | 87.5% |
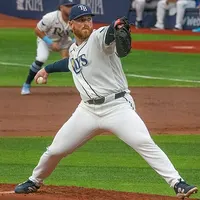 Drew Rasmussen Drew Rasmussen | TB | 30 | 26 | 86.7% |
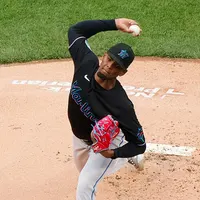 Edward Cabrera Edward Cabrera | CHC | 15 | 13 | 86.7% |
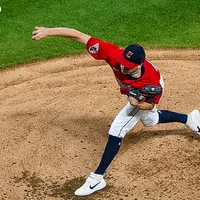 Cal Quantrill Cal Quantrill | TEX | 15 | 13 | 86.7% |
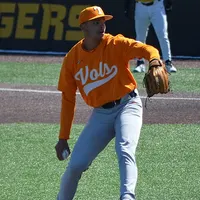 Chase Burns Chase Burns | CIN | 29 | 25 | 86.2% |
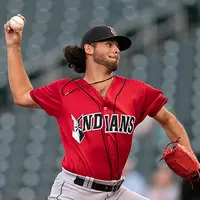 Jared Jones Jared Jones | PIT | 21 | 18 | 85.7% |
| Chris Sale | ATL | 27 | 23 | 85.2% |
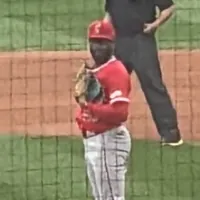 Walbert Ureña Walbert Ureña | LAA | 27 | 23 | 85.2% |
| Hunter Brown | HOU | 20 | 17 | 85% |
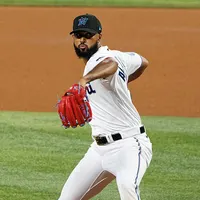 Sandy Alcantara Sandy Alcantara | MIA | 33 | 28 | 84.8% |
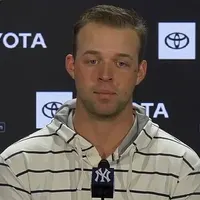 Michael King Michael King | SD | 32 | 27 | 84.4% |
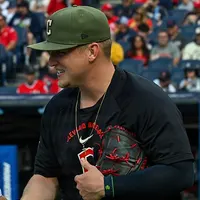 Parker Messick Parker Messick | CLE | 32 | 27 | 84.4% |
 Jack Flaherty Jack Flaherty | DET | 19 | 16 | 84.2% |
| Brandon Pfaadt | AZ | 19 | 16 | 84.2% |
| Shane Drohan | MIL | 19 | 16 | 84.2% |
| Jake Bennett | BOS | 19 | 16 | 84.2% |
 Janson Junk Janson Junk | MIA | 25 | 21 | 84% |
 Keider Montero Keider Montero | DET | 25 | 21 | 84% |
Photos: Andrew Alvarez: Keiteay, CC BY 4.0 · Jesús Luzardo: Ryan Casey Aguinaldo, CC BY-SA 4.0 · Trevor Rogers: D. Benjamin Miller, CC0 · Kyle Bradish: Reunion, CC BY 4.0 · Casey Mize: False casey, CC BY-SA 4.0 · Cam Schlittler: Jeffrey Hyde, CC BY-SA 2.0 · Shane McClanahan: Raysfanjake1984, CC0 · Drew Rasmussen: Raysfanjake1984, CC0 · Edward Cabrera: D. Benjamin Miller, CC0 · Cal Quantrill: Erik Drost, CC BY 2.0 · Chase Burns: edwarddallas, Public domain · Jared Jones: Minda Haas Kuhlmann, CC BY 2.0 · Chris Sale: Keith Allison from Hanover, MD, USA, CC BY-SA 2.0 · Walbert Ureña: YeetV4, CC BY-SA 4.0 · Sandy Alcantara: D. Benjamin Miller, CC0 · Michael King: YESNetwork, CC BY 3.0 · Parker Messick: Petty Officer Third Class Michael Lauofo, Public domain · Jack Flaherty: Ryan Casey Aguinaldo, CC BY-SA 4.0 · Janson Junk: Bryan Green, CC BY-SA 2.0 · Keider Montero: Ian D'Andrea, CC BY-SA 2.0 via Wikimedia Commons.
Source: MLB Stats API (statsapi.mlb.com). 2026 regular season unless marked otherwise. Updated Oct 6, 2026, 4:51 AM ET. Full-game basis: a game counts as NRFI only when both halves of the first inning are scoreless.
The first inning is the only part of a baseball game where you know exactly who will bat. Each lineup’s top three hitters will come up, and both starters are fresh. That predictability is why the NRFI market grew so quickly, and why a clean set of first-inning numbers is worth more here than almost anywhere else in baseball betting. The tables above are ours, computed from every completed regular-season game; the rest of this page explains how to read them and how to turn them into a decision.
What NRFI and YRFI mean
NRFI stands for No Run First Inning. You are betting that the game is still 0-0 when the first inning ends: the away team fails to score in the top half, and the home team fails to score in the bottom half. YRFI, Yes Run First Inning, is the other side of the same market. It wins if anybody scores in the first, whether that is a leadoff home run or a bases-loaded walk with two outs in the bottom half.
Most books price the two sides against each other, often with one around -120 and the other around even money, depending on the matchup. Some also offer team-level versions: a bet on whether just the away team, or just the home team, scores in its half of the first. Those are different bets with different math, and the difference shows up in how our tables count.

How our NRFI stats are counted
There are two ways to count a NRFI, and mixing them up is the most common mistake in NRFI stats you find online.
Full-game basis (the team table)
The team table uses the full-game basis, which matches the standard NRFI bet. A game counts as a NRFI for both clubs only when both halves of the first inning are scoreless. So a team’s NRFI percentage reflects its own hitters and its own pitchers together. A club with a great first-inning pitching staff can still post a middling rate if its lineup scores early a lot, because those games are YRFI too.
That is why the table splits the team stats further. “Scored in 1st” is the share of a team’s games in which it scored in its own half of the first. “Allowed in 1st” is the share in which its opponent did. Read those two columns side by side and you can see why a team sits where it does. A club that rarely scores in the first and rarely allows a run in the first will rank near the top. A club that does both a lot will sit near the bottom, and it is usually the one you would look at for a YRFI.
Team-half basis (the starter table)
The starter table asks a narrower question: in games where this pitcher was the listed starter, how often did the opponent fail to score in its half of the first? That is a clean first inning for the pitcher’s side, and it says nothing about what his own hitters did. To be included, a pitcher needs at least 15 listed starts.
Two caveats. First, “listed starter” means the probable pitcher MLB had on record for the game. When a team used an opener, or a starter was scratched late, the listed name may not have thrown the first pitch, and the row inherits that noise. Second, the rate includes runs scored off the starter and off anyone who replaced him in the first, which is exactly how the bet settles, but it is not the same as the pitcher’s personal ERA in the first inning.
How often does a NRFI hit?
The league figure is at the top of the team table, and it moves a little from year to year as scoring rises and falls. Over a full season the split between NRFI and YRFI tends to be close to even, which is the whole point: the market is close to a coin flip, and a coin flip is only worth betting when the price is better than the true odds.
That makes the league rate a baseline rather than a signal. If the league runs near 50% and a book prices every NRFI at -120, betting all of them would lose over time. The work is in finding the specific games where the true chance is clearly above the break-even rate.
Why the top of the order and the starter matter most
A first inning is short and predictable. The leadoff hitter, the two-hole hitter and the three-hole hitter all bat, and the cleanup hitter often does too. Teams put their best on-base and power hitters at the top, so the first inning is, on average, the one where a pitcher faces the strongest part of a lineup.
That is why the listed starter matters so much in NRFI bets. A pitcher who walks the leadoff man is suddenly pitching from the stretch to a lineup’s best hitters. A starter with a high strikeout rate and a low walk rate can get through the top three with nobody on base. Some pitchers are known for slow starts, needing an inning to find their command, while others are sharpest early. The starter table above is the quickest way to see which is which, and our probable pitchers board tells you who is actually starting today.
The lineup matters just as much. A team whose first three hitters get on base often will score in the first even against good pitching. Check the “Scored in 1st” column for both teams: when both are high, a YRFI is worth considering; when both are low, you have a starting point for a NRFI.
Park, weather and the first inning
Ballparks and conditions affect the first inning like any other. A game at Coors Field in Denver, where the thin air helps the ball carry, is a harder NRFI than the same matchup at a pitcher-friendly park near the ocean. Wind blowing out at Wrigley Field on a summer afternoon changes things too, as does heat, which helps the ball travel. Our page on ballpark run environment shows scoring by venue so you can put a park in context. Weather is not in our tables, so check the forecast for games with wind or a temperature at either extreme.
Reading the tables before a bet
Here is a simple way to combine the numbers for a single game. Take the away team’s starter and look at his clean first-inning rate. Then do the same for the home starter. Say the first is 76% and the second is 72%. If the two halves were independent, the chance that both are scoreless would be roughly 0.76 × 0.72, which is about 55%. That is a rough first estimate, not a forecast, because it ignores who is batting.
Then adjust with the team columns. If the home team’s “Scored in 1st” rate is well above average, the 72% for the away starter should come down a few points. If it is low, it can go up. Park and weather move it again. You end up with a number you can compare to the price, which is the only comparison that matters.
Sample size: the trap in NRFI stats
NRFI stats look precise, but they are built on small samples. A starter with 15 starts has 15 first innings on record. If he was clean in 12 of them, his rate is 80%, and one bad inning would drop it to 73%. That is not a meaningful difference in skill, just the result of one outcome.
The team table is steadier because every game counts, but even a full season of 162 games leaves a lot of noise in a stat with only two outcomes per game. As a rule of thumb, treat a gap of a few percentage points between two teams as a tie. Look for bigger gaps, and look for them to agree with what you already know about the pitchers and lineups. When the only reason to like a NRFI is that a starter ranks high on a 16-start sample, the reason is thin.
Converting a NRFI price to a break-even rate
Every price has a break-even win rate built into it. For American odds, a negative price like -120 means you risk $120 to win $100, so you need to win 120 ÷ 220, or 54.5% of the time, to break even. At -130 you need 56.5%. At +100 you need exactly 50%.
Put it in dollars: a $50 NRFI bet at -120 returns $91.67 if it wins, your $50 stake plus $41.67 profit. If your estimate for the game is 55%, you are barely above break-even at -120 and below it at -130. That is a pass at -130 no matter how much you like the starters. Our odds calculators do this conversion for any price, and they are the fastest way to check whether a line clears your own estimate. If you are new to American odds, our guide to reading baseball betting lines explains the minus and plus signs.
Keep the stakes small in a market this close to a coin flip, set a budget before the season starts, and remember that betting is for adults 21 and older. If it stops being fun, 1-800-GAMBLER is free and confidential.
NRFI betting rules and pitcher changes
A few settlement questions come up again and again, and they are worth knowing before you bet.
Unearned runs count. The bet is about runs on the scoreboard. If a shortstop throws the ball away and a run scores, the first inning is not scoreless, and a NRFI loses even though the pitcher’s ERA is untouched.
Suspended or shortened games. Most books settle a NRFI as soon as the first inning is complete, because nothing that happens later can change the result. If rain stops a game after the first inning, the bet is still graded. If the game is called before the first inning is finished while it is still scoreless, the bet is generally void. If the away team has already scored in the top half, a YRFI is decided and most books grade it even if the bottom half is never played.
Pitcher changes. Many NRFI bets are placed with action, meaning they stand whoever starts. If you placed yours with listed pitchers and one of the named starters does not throw the first pitch, the bet is usually void. The exact rules vary from book to book, and our page on baseball betting rules walks through them in more detail.
Where NRFI fits with other early-game bets
A NRFI is the most concentrated early-game bet in baseball: one inning, both starters, the top of both lineups. If you like a pitching matchup but are worried about one bad frame, first 5 innings bets spread the risk over more innings while still cutting out the bullpens. Some books also price first-inning props, such as whether a specific pitcher records a strikeout in the first, which sit in the same family as other prop bets.
If you want to see how a NRFI and YRFI read looks on the actual slate, each game’s matchup card on our baseball picks page shows both teams’ first-inning rates next to the listed starters. The homepage has the full list of data pages and guides.
One last thing about the starter table: pitchers near the bottom are not always bad pitchers. A high-strikeout starter can still give up a first-inning run a few times a month to a lineup’s best hitters, then settle in and throw six strong innings. For a NRFI bet that first inning is the whole bet, and for almost any other market it is only a small part of the game.

_(cropped).jpg)
_(cropped).jpg)

_(cropped).jpg)


_(cropped).jpg)


.jpg)


_(cropped).jpg)
_(cropped).jpg)
_(cropped).jpg)
.jpg)
.jpg)
.jpg)

_(cropped).jpg)


_(cropped).jpg)
